A Beginner’s Guide: How to Read a Candlestick Chart

Welcome to “A Beginner’s Guide: How to Read a Candlestick Chart.” In this article, you will learn the basics of interpreting a candlestick chart, a valuable tool used in stock market analysis. By understanding the different components of a candlestick and what they represent, you will be on your way to becoming a more informed investor. So, let’s dive in and unravel the mystery of candlestick charts together!
A Beginner’s Guide: How to Read a Candlestick Chart
If you’re new to trading or investing in the financial markets, you may have come across candlestick charts. At first glance, these charts can be intimidating and confusing, but they are actually a powerful tool used by traders to analyze price trends and make informed decisions. In this beginner’s guide, we’ll break down everything you need to know about reading a candlestick chart.

What is a Candlestick Chart?
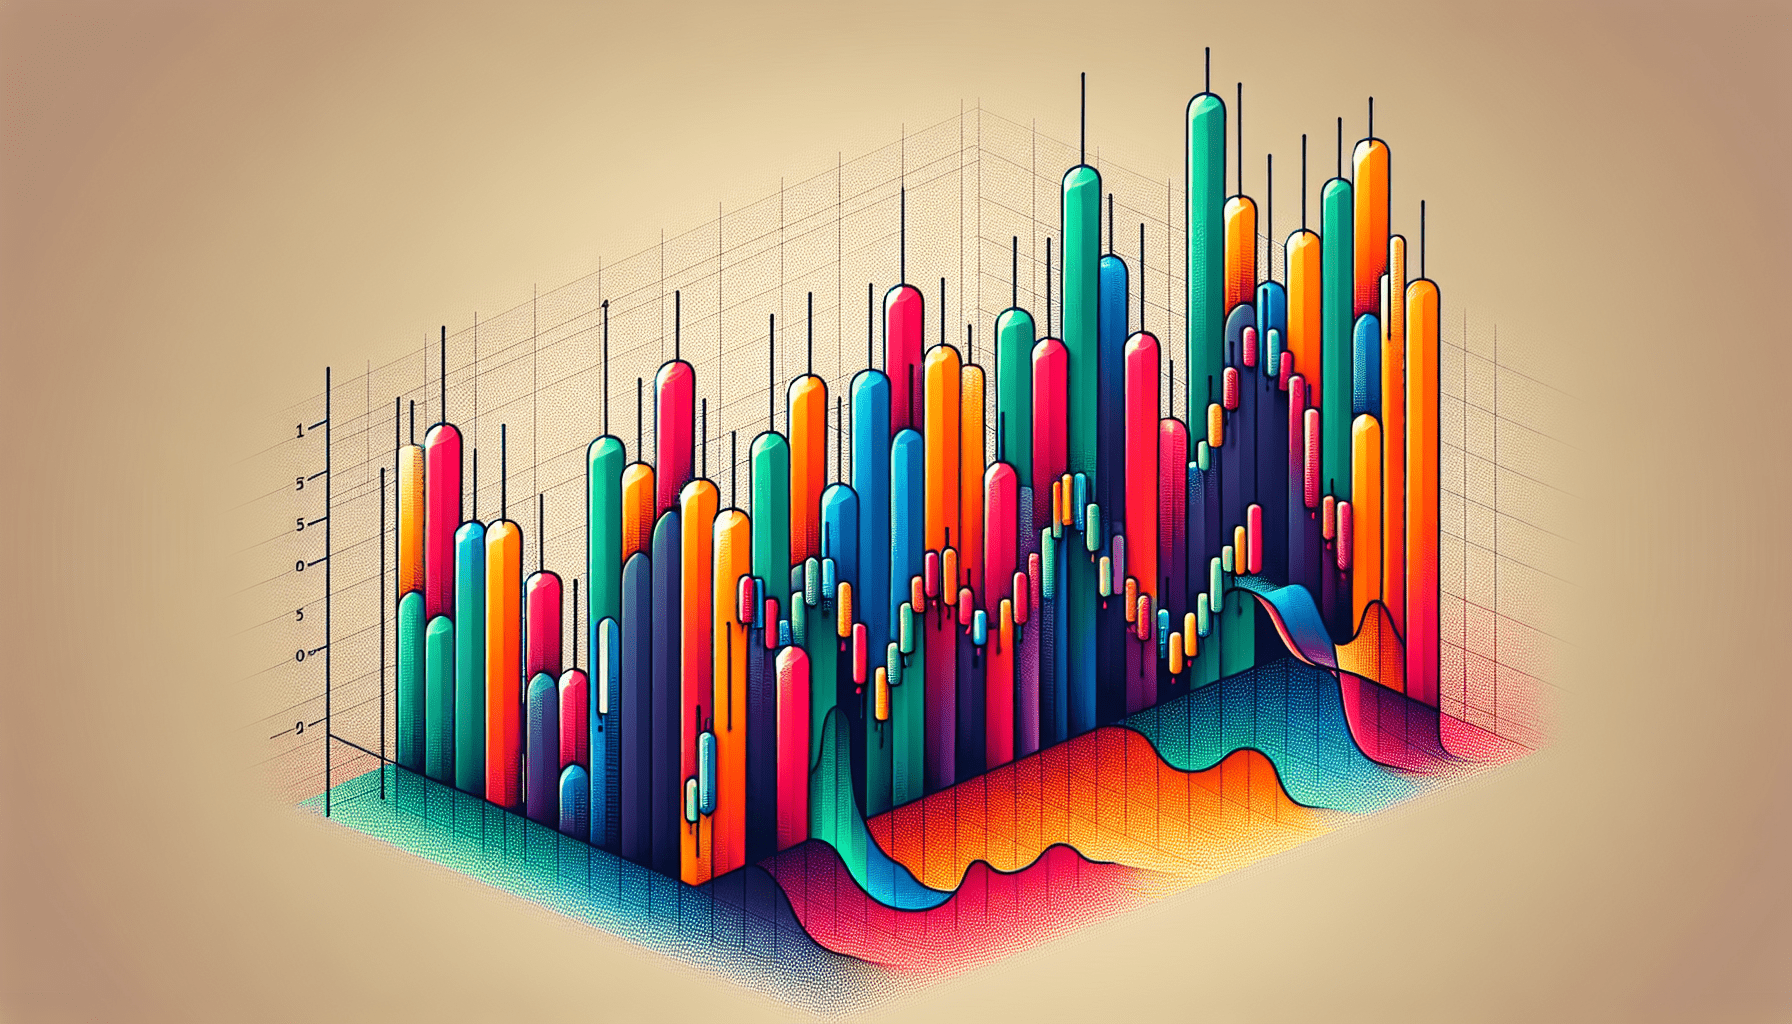
A candlestick chart is a type of financial chart used to represent the price movements of an asset over a specific period of time. Each candlestick on the chart provides valuable information about the open, high, low, and close prices of the asset within that time frame. The body of the candlestick represents the opening and closing prices, while the wicks or shadows indicate the high and low prices during the period.
Components of a Candlestick
Each candlestick on a chart consists of three main parts: the body, the wick (or shadow), and the color. The body of the candlestick represents the price range between the opening and closing prices. If the closing price is higher than the opening price, the body is typically filled or outlined in green, indicating a bullish or positive trend. Conversely, if the closing price is lower than the opening price, the body is usually filled or outlined in red, signaling a bearish or negative trend.
The wicks or shadows protruding from the top and bottom of the body show the highest and lowest prices reached during that period. This information provides insights into the price volatility and trading range for the asset.
Types of Candlestick Patterns
Candlestick charts display various patterns that traders use to predict future price movements. Some common candlestick patterns include doji, hammer, shooting star, engulfing, and spinning top, among others. These patterns indicate potential trend reversals or continuations and help traders make decisions about buying or selling assets.
Understanding these candlestick patterns and how to interpret them can give you a significant edge in analyzing market trends and making informed trading decisions.
Reading a Candlestick Chart
Now that you know the basics of candlestick charts, let’s walk through how to read them step by step:
-
Identify the Timeframe: Start by selecting the timeframe you want to analyze, whether it’s minutes, hours, days, weeks, or months. Each candlestick represents the price action within that specific timeframe.
-
Recognize the Candlestick: Look at the individual candlesticks on the chart. Determine whether each candlestick is bullish (green) or bearish (red) based on the opening and closing prices. Pay attention to the length of the body and the size of the wicks to gauge price volatility.
-
Analyze the Patterns: Identify any recognizable candlestick patterns or formations, such as doji, engulfing, or hammer. These patterns can give you clues about potential price reversals or continuations.
-
Confirm with Indicators: Use technical indicators or chart patterns to confirm the signals provided by the candlestick chart. Combining candlestick analysis with other tools can strengthen your trading strategy and improve decision-making.

Common Mistakes to Avoid
As you start reading candlestick charts and analyzing price movements, it’s essential to be aware of common mistakes that beginners often make. Avoiding these pitfalls can help you interpret charts more accurately and make better trading decisions:
-
Overlooking Risk Management: Focusing solely on candlestick patterns without considering risk management strategies can lead to substantial losses. Always have a risk management plan in place to protect your capital.
-
Relying Too Heavily on Patterns: While candlestick patterns are valuable indicators, they should not be the sole basis for your trading decisions. Use a combination of technical analysis tools and fundamental research to make well-rounded judgments.
-
Ignoring Market Context: Context is crucial when interpreting candlestick charts. Consider the broader market trends, news events, and economic factors that may impact price movements. Contextualizing your analysis can lead to more accurate forecasts.
-
Neglecting Practice and Education: Reading candlestick charts is a skill that requires practice and continuous learning. Take the time to educate yourself on different patterns, strategies, and market dynamics to enhance your trading proficiency.
Putting It All Together
Reading candlestick charts may seem daunting at first, but with practice and a solid understanding of the basics, you can interpret these charts effectively and make informed trading decisions. Remember to start small, gradually build your knowledge and skills, and seek guidance from experienced traders or mentors along the way. By combining technical analysis with other tools and strategies, you’ll be better equipped to navigate the financial markets confidently.
So, the next time you encounter a candlestick chart, remember to analyze the components, identify patterns, confirm with indicators, and avoid common mistakes. With time and dedication, you’ll develop a keen eye for reading candlestick charts and maximizing your trading potential.


