How Do I Read A Candlestick Chart?

So you’ve come across a candlestick chart and now you’re wondering, “How do I read it?” Well, worry no more because in this article, we’ll break down the basics for you. Candlestick charts are visual representations of price movements in the financial market, often used in technical analysis. Each candlestick represents a specific time period and provides valuable information about the opening, closing, high, and low prices during that period. By learning how to interpret these candlestick patterns, you’ll gain valuable insights into market trends and be better equipped to make informed trading decisions. So let’s dive right in and unravel the secrets of reading a candlestick chart!
Understanding Candlestick Charts
What is a Candlestick Chart?
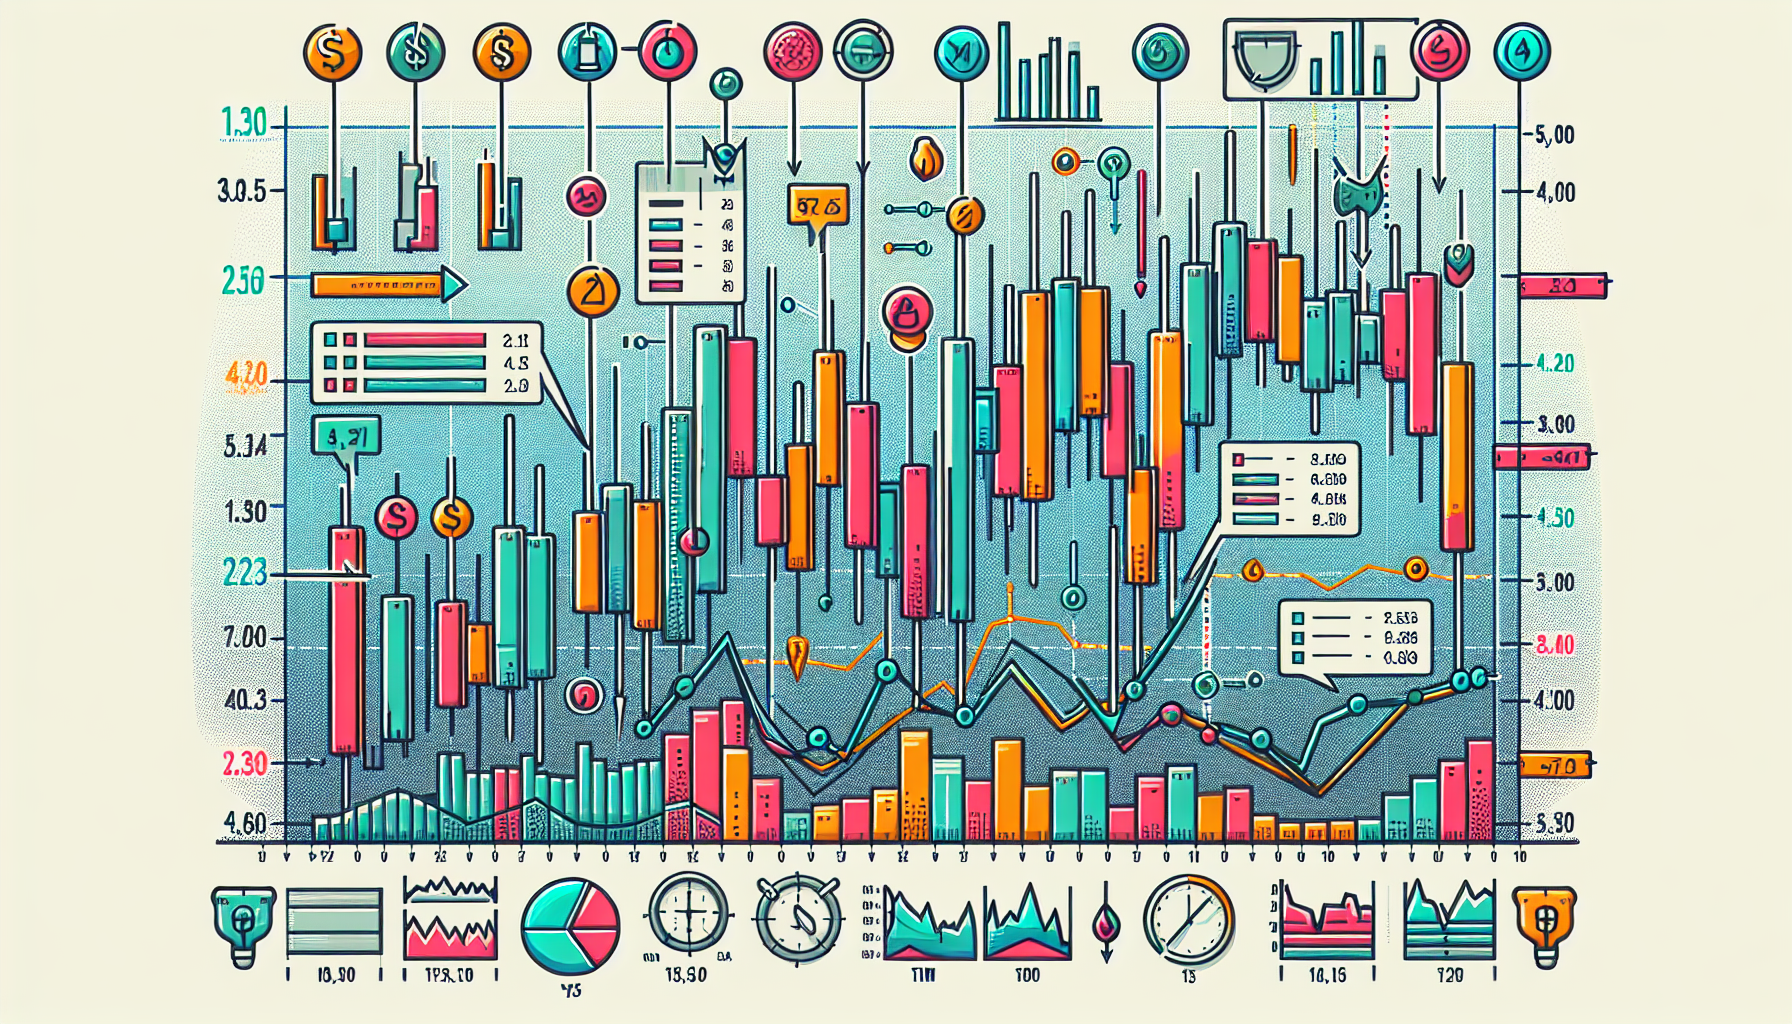
A candlestick chart is a type of financial chart used to represent the price movement of an asset, such as stocks, currencies, or commodities, over a specific time period. It is made up of individual “candles” that provide information about the opening, closing, high, and low prices of the asset for each period.
Why are Candlestick Charts Used?
Candlestick charts are widely used by traders and investors because they provide valuable insights into market psychology and help identify potential trend reversals or continuations. The visual representation of price patterns and trends makes it easier to analyze and make informed trading decisions.
Parts of a Candlestick
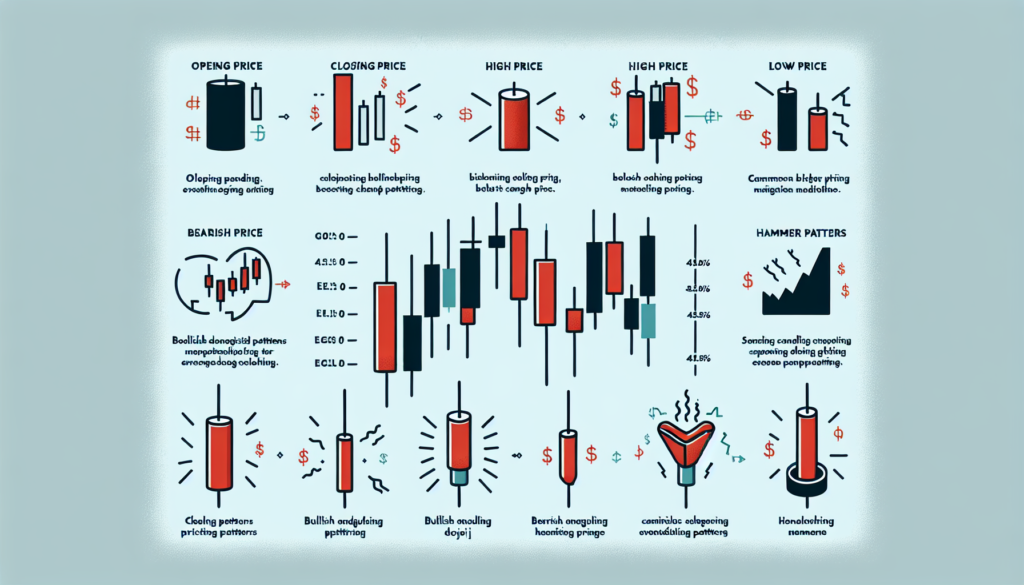
Each candlestick consists of a rectangular body, representing the price range between the opening and closing prices, and two thin lines or “wicks” above and below the body, representing the high and low prices reached during the period. The color of the body, either green or red, indicates whether the closing price was higher or lower than the opening price.
Different Types of Candlestick Patterns
Candlestick patterns are formed by the arrangement of multiple consecutive candles and provide valuable information about the future direction of the price. There are various types of candlestick patterns, including bullish, bearish, reversal, continuation, and doji patterns. Each pattern has its own unique characteristics and implications for traders.
How to Interpret Candlestick Patterns
Interpreting candlestick patterns involves analyzing the relationship between the current pattern and previous patterns, as well as considering other technical indicators and the overall market context. By understanding the different patterns and their significance, traders can gain insights into market sentiment and make more informed trading decisions.
Reading Candlestick Patterns
Bullish Candlestick Patterns
Bullish candlestick patterns indicate potential upward price movement and suggest buying opportunities. Examples of bullish patterns include the hammer, morning star, and bullish engulfing patterns. These patterns often signify market reversal or the continuation of an existing bullish trend.
Bearish Candlestick Patterns
Bearish candlestick patterns indicate potential downward price movement and suggest selling opportunities. Examples of bearish patterns include the shooting star, evening star, and bearish engulfing patterns. These patterns often signal market reversal or the continuation of an existing bearish trend.
Reversal Candlestick Patterns
Reversal candlestick patterns indicate a potential change in the direction of the prevailing trend. These patterns often appear at the end of a trend and suggest a possible trend reversal. Examples of reversal patterns include hammers, shooting stars, and evening and morning stars.
Continuation Candlestick Patterns
Continuation candlestick patterns suggest that the prevailing trend is likely to continue. These patterns often occur during periods of consolidation or temporary price retracements. Examples of continuation patterns include bullish and bearish flags, pennants, and triangles.
Doji Candlestick Patterns
Doji candlestick patterns occur when the opening and closing prices are very close or equal, resulting in a small or nonexistent body. Doji patterns indicate market indecision and can suggest potential trend reversals or continuations, depending on their placement within the overall price action and the preceding trend.

Key Candlestick Patterns
Hammer
The hammer pattern is a bullish reversal pattern that consists of a small body and a long lower wick. It suggests that buyers have overcome sellers, and the price is likely to move higher.
Shooting Star
The shooting star pattern is a bearish reversal pattern that consists of a small body and a long upper wick. It suggests that sellers have regained control, and the price is likely to move lower.
Bullish Engulfing
The bullish engulfing pattern occurs when a small bearish candle is followed by a larger bullish candle that completely engulfs the previous candle. It suggests a potential bullish reversal.
Bearish Engulfing
The bearish engulfing pattern is the opposite of the bullish engulfing pattern. It occurs when a small bullish candle is followed by a larger bearish candle that completely engulfs the previous candle. It suggests a potential bearish reversal.
Doji
The doji pattern occurs when the opening and closing prices are very close or equal, resulting in a small or nonexistent body. It indicates market indecision and can suggest potential trend reversals or continuations.
Morning Star
The morning star pattern is a bullish reversal pattern that consists of a long bearish candle, followed by a small-bodied candle with a lower opening and closing price, and a third bullish candle that completely engulfs the first bearish candle.
Evening Star
The evening star pattern is the opposite of the morning star pattern. It is a bearish reversal pattern that consists of a long bullish candle, followed by a small-bodied candle with a higher opening and closing price, and a third bearish candle that completely engulfs the first bullish candle.
Hanging Man
The hanging man pattern is a bearish reversal pattern that has a small body and a long lower wick. It suggests a potential trend reversal from bullish to bearish.
Inverted Hammer
The inverted hammer pattern is a bullish reversal pattern that has a small body and a long upper wick. It suggests a potential trend reversal from bearish to bullish.
Piercing Pattern
The piercing pattern is a bullish reversal pattern that occurs when a bearish candle is followed by a bullish candle that opens below the previous candle’s low and closes above its midpoint.
Identifying Support and Resistance Levels
How Support and Resistance Levels Influence Candlestick Patterns
Support and resistance levels are horizontal lines drawn on a chart to identify price levels where the asset has historically struggled to move above (resistance) or below (support). These levels can influence the formation and interpretation of candlestick patterns, as they represent areas where buyers and sellers are likely to enter or exit positions.
Using Candlestick Patterns to Identify Support Levels
Candlestick patterns can be used to identify potential support levels where buying pressure might increase, causing the price to bounce back up. For example, bullish reversal patterns forming near a previous support level can indicate a higher probability of a trend reversal.
Using Candlestick Patterns to Identify Resistance Levels
Candlestick patterns can also be used to identify potential resistance levels where selling pressure might increase, causing the price to drop. For example, bearish reversal patterns forming near a previous resistance level can suggest a higher probability of a trend reversal.
Combining Candlestick Patterns with Support and Resistance
By combining candlestick patterns with support and resistance levels, traders can enhance their analysis and increase the accuracy of their trading decisions. The confluence of multiple factors, such as a bullish reversal pattern forming near a strong support level, can provide a higher probability trading setup.

Using Candlestick Chart Indicators
Moving Averages
Moving averages are technical indicators that smooth out price data over a specific period to identify overall trends. By plotting moving averages on a candlestick chart, traders can gain additional insights into the strength and direction of the prevailing trend.
Volume
Volume is a measure of the number of shares or contracts traded during a specific time period. Analyzing volume alongside candlestick patterns can provide confirmation or divergence signals, indicating the strength or weakness of a price move.
Relative Strength Index (RSI)
The Relative Strength Index (RSI) is a momentum oscillator that measures the speed and change of price movements. When combined with candlestick patterns, the RSI can help identify overbought or oversold conditions, confirming potential trend reversals.
Stochastic Oscillator
The Stochastic Oscillator is another momentum indicator that compares the closing price of an asset to its price range over a specific period. It can be used in conjunction with candlestick patterns to identify potential trend reversals or continuations.
MACD (Moving Average Convergence Divergence)
The Moving Average Convergence Divergence (MACD) is a versatile indicator that combines moving averages with histogram bars. It can be used to identify trend direction, momentum, and potential buy or sell signals when used in conjunction with candlestick patterns.
Candlestick Chart Timeframes
Different Timeframes in Candlestick Charts
Candlestick charts can be displayed in various timeframes, such as daily, weekly, hourly, or even minute intervals. Each timeframe represents a different level of detail and provides insights into different trading styles and strategies.
Choosing the Right Timeframe
Choosing the right timeframe depends on the trader’s objectives, trading style, and the asset being analyzed. Short-term traders may prefer shorter timeframes for more frequent trading opportunities, while long-term investors may focus on longer timeframes to identify broader trends and patterns.
Identifying Patterns in Different Timeframes
Analyzing candlestick patterns across different timeframes allows traders to identify patterns and trends at multiple scales. For example, a bullish reversal pattern on a shorter timeframe might align with a bearish continuation pattern on a longer timeframe, providing additional confirmation for a trading decision.
Considerations When Analyzing Multiple Timeframes
When analyzing multiple timeframes, it’s essential to consider the relationships between the patterns and trends on each timeframe. Higher timeframes often have more significant impact and can override signals from lower timeframes. However, aligning patterns across multiple timeframes can increase the probability of successful trades.
Risk Management with Candlestick Charts
Setting Stop-Loss Levels
A stop-loss order is a risk management tool that specifies the price at which a trader is willing to exit a trade to limit potential losses. By analyzing candlestick patterns and identifying key support and resistance levels, traders can set appropriate stop-loss levels to protect their capital.
Determining Take-Profit Levels
A take-profit order is a trading order that specifies the price at which a trader wants to exit a profitable trade to lock in gains. By considering candlestick patterns, support and resistance levels, and taking into account the potential upside of a trade, traders can determine appropriate take-profit levels.
Using Candlestick Patterns for Entry and Exit Points
Candlestick patterns can be used as signals for entry and exit points in trades. Bullish reversal patterns can indicate entry points for long positions, while bearish reversal patterns can suggest entry points for short positions. Traders can also use candlestick patterns to time their exits based on potential trend reversals or continuation signals.
Risk-Reward Ratio Analysis
Risk-reward ratio analysis involves assessing the potential profit versus the potential loss of a trade. By analyzing candlestick patterns and determining key support and resistance levels, traders can evaluate the risk-reward ratio of a trade and make informed decisions that align with their risk tolerance.
Practical Tips for Reading Candlestick Charts
Always Consider the Overall Market Trend
When reading candlestick charts, it is crucial to consider the overall market trend. Candlestick patterns can be more reliable when they align with the prevailing trend. Recognizing the trend can help traders avoid potential false signals and increase the accuracy of their analysis.
Practice Patience and Wait for Confirmation
While candlestick patterns can provide valuable insights, it is essential to wait for confirmation before taking action. This can involve waiting for the completion of a pattern or the occurrence of additional supporting indicators. Patience and discipline are key when reading candlestick charts.
Be Aware of False Signals
False signals can occur in any market and can mislead traders. It is important to be aware of the possibility of false signals when reading candlestick charts. Validating signals with other indicators, assessing the overall market context, and using proper risk management techniques can help minimize the impact of false signals.
Combine Candlestick Patterns with Other Technical Analysis Tools
Candlestick patterns are most effective when used in conjunction with other technical analysis tools. This can include trendlines, moving averages, Fibonacci retracements, and other indicators. Combining multiple tools can provide a more comprehensive analysis and increase the effectiveness of trading decisions.
Keep Learning and Adapting
Reading candlestick charts is a skill that requires continuous learning and adaptation. Markets are dynamic and constantly evolving, so it is crucial to stay informed about new patterns, techniques, and market developments. Regularly reviewing and updating trading strategies based on new information can lead to improved performance.
Common Mistakes when Reading Candlestick Charts
Ignoring the Overall Market Context
One common mistake when reading candlestick charts is ignoring the overall market context. Failing to consider the broader market trends, economic factors, or news events can lead to misinterpretation of candlestick patterns and incorrect trading decisions. Traders should always assess the market context before making trading judgments.
Misinterpreting Candlestick Patterns
Misinterpreting candlestick patterns is another common mistake that can lead to trading losses. It is important to understand the characteristics and implications of each pattern and not rely solely on the appearance of a single pattern. Considering other factors, such as volume, support and resistance levels, and the overall trend, can help avoid misinterpretation.
Overlooking Confirmation Signals
Confirmation signals are additional indicators or patterns that support the validity of a candlestick pattern. Overlooking these signals can result in missed trading opportunities or increased risk. It is important to consider confirmation signals to increase the probability of successful trades.
Relying Solely on Candlestick Patterns
Although candlestick patterns are valuable tools for technical analysis, relying solely on them can be risky. It is essential to consider other factors, such as fundamental analysis, market sentiment, and economic indicators, to make well-informed trading decisions.
Failing to Manage Risks Properly
Risk management is an integral part of successful trading. Failing to set appropriate stop-loss levels, determine take-profit levels, or properly assess the risk-reward ratio can lead to significant losses. It is important to prioritize risk management when reading candlestick charts.
Conclusion
Understanding candlestick charts is a valuable skill for traders and investors in the financial markets. By learning to read and interpret candlestick patterns, traders can gain insights into market sentiment, identify potential trend reversals or continuations, and make more informed trading decisions. However, it is important to remember that candlestick patterns are just one tool among many in a trader’s arsenal. Constant learning and practice, combined with proper risk management and consideration of other technical indicators and market contexts, are key to using candlestick charts effectively. Continuous improvement and adaptation to changing market conditions will ultimately lead to greater success in trading.


